
Make the picture do a different job from the captions
If the title, a large card and the subtitles repeat the same sentence, the viewer has several places to read and little extra help understanding. Start by deciding what each layer should do: the voice explains the point, captions make the speech readable, and the main visual shows the structure or setting.
This does not mean removing all text. A short label, a number with its unit or a clearly named step can be the most useful part of a scene. The question is what helps someone understand the current line of narration.

Use numbers when the source supports a number
For a claim such as “try a 25-minute focus block,” the number and unit belong together. Keep the word “try” in the narration or supporting wording so an experiment is not presented as a universal rule.
Avoid turning an isolated number into a chart without the data that makes the chart meaningful. A percentage needs a defined whole; a comparison needs comparable quantities. If that context is absent, a clear text emphasis is more honest than an impressive-looking graphic.
Use a step diagram for an actual sequence
Ordered instructions benefit from a path. In the focused-work example, the sequence is:
- Choose one task.
- Close extra tabs.
- Start your timer.
Each step gets a short label, and emphasis moves through the sequence. Keep the order the source requires. If the source describes independent ideas, do not add arrows that imply they must happen in that order.
The complete focused-work video includes this sequence in context. It is an authored demonstration of the visual format, not proof of the routine's effectiveness.
Use connections to explain relationships
A relationship diagram can make a connection easier to see, but the shape of the connection matters. An undirected line says two things are related; an arrow can suggest a direction, process or cause.
Only show a causal or ordered direction when the explanation supports it. If a passage names a researcher, an AI assistant and several projects, it may be useful to show their connections. It would be a different claim to suggest that the tool independently produces successful outcomes.
For dense material, show fewer items at once and preserve the full statement where qualifications matter. Do not shorten a label so much that “may help” becomes “helps” or a range turns into a single exact figure.
Use an illustration for a setting or a concrete subject
An illustration can give a viewer an immediate sense of a workspace, an object or a situation. In the example below, the picture supports the change from a crowded desktop to a calmer focus block. Captions still carry the spoken explanation.
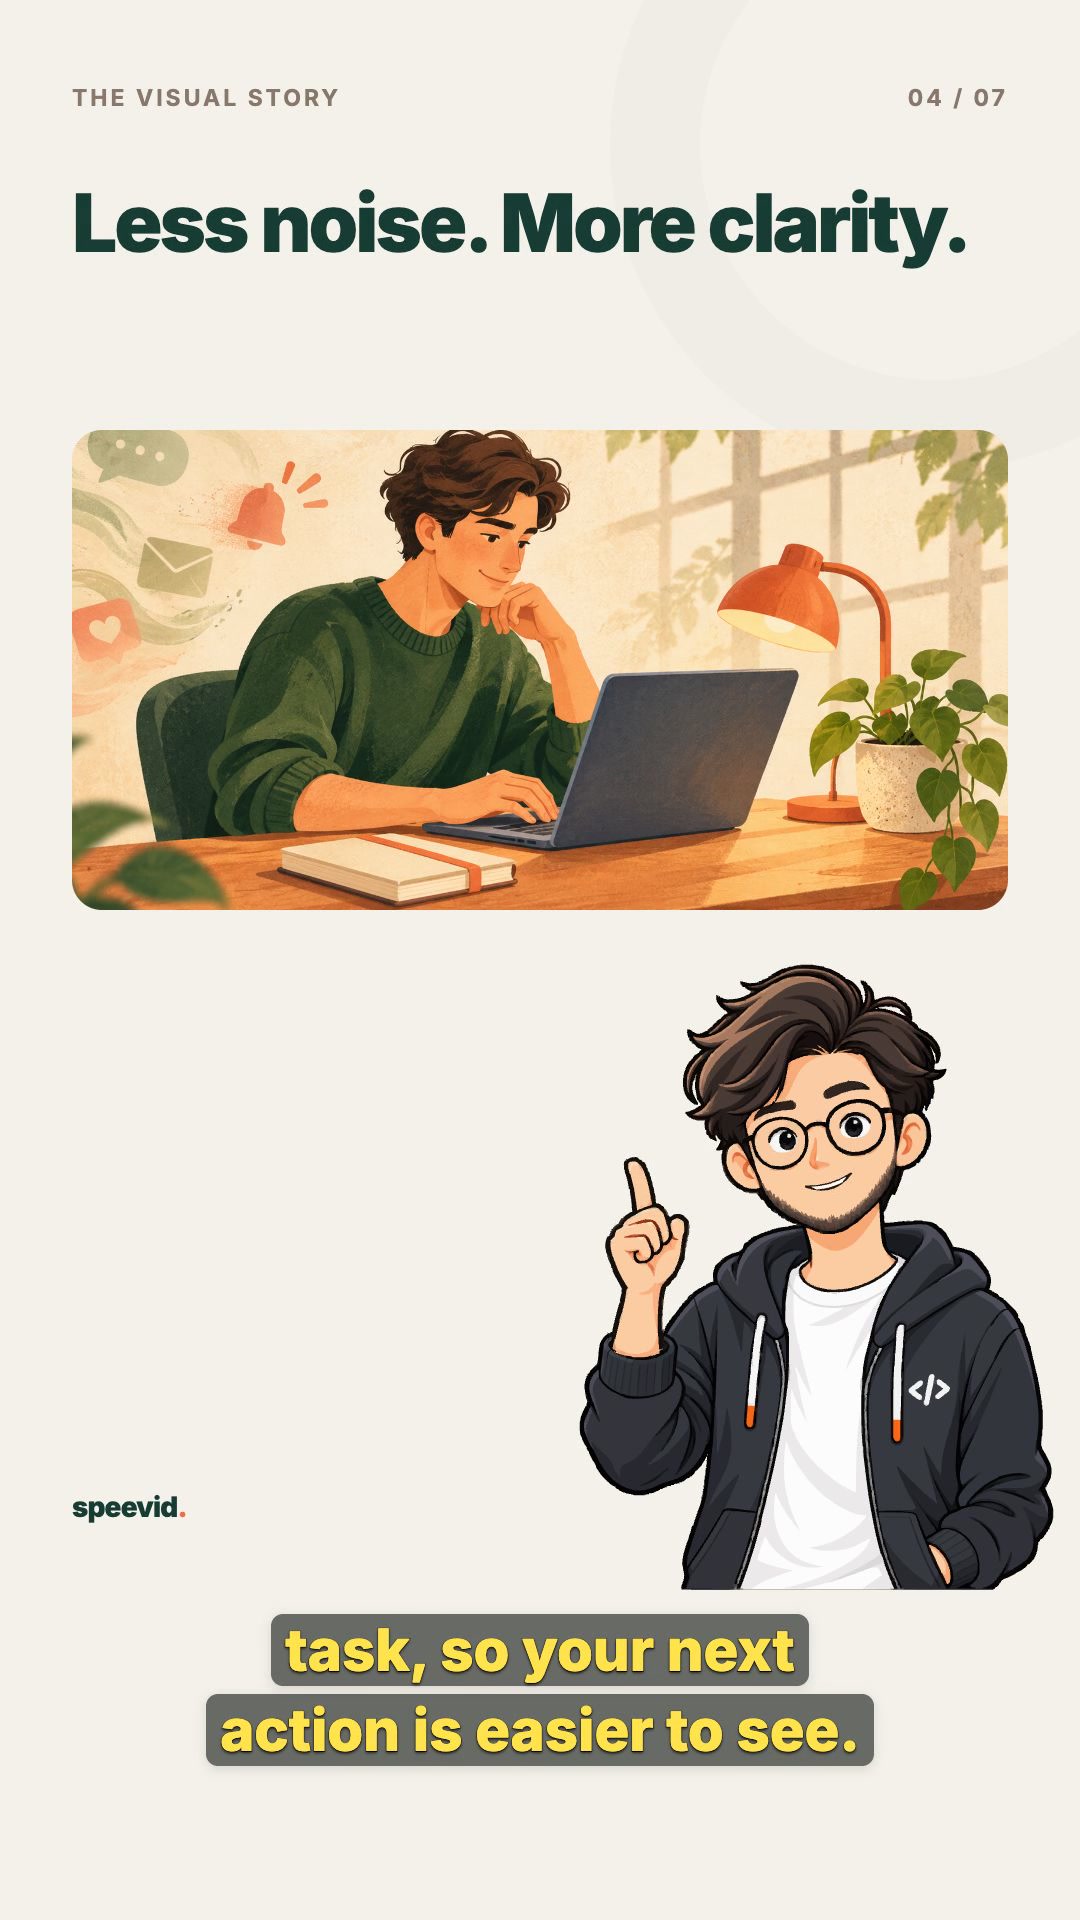
This is a concept image. It is not a photograph of an actual person or evidence that an event happened. Exact names, labels, charts and numbers are better added as controlled video elements than baked into generated artwork.
Single-scene illustrations must be enabled on the Speevid deployment. When available, choose Illustration in the scene editor and generate one image or upload a still PNG, JPEG or WebP. Uploads are limited to 10 MiB and 16 megapixels. If image generation is not configured, an enabled deployment can still accept uploads.
Keep movement small and purposeful
The image does not need to become an AI-generated video to feel less static. A slow push in or a small pan can guide attention while leaving the subject readable. Still image is also a useful option when motion would distract from a precise explanation.
Adjust the focal point so the important part of the image stays inside the frame. Review the whole scene, including its beginning and ending. Keep important labels away from the presenter and the caption area.
Save the scene you actually want to export
Generating or uploading creates a candidate. It does not replace the saved scene automatically. Select the candidate, choose movement and focus, preview the result and use Save scene to apply it.
Use Discard changes to return to the saved version. Choose Graphic and save if the original diagram explains the point better. These visual changes preserve the spoken narration, captions and timing; older exported versions keep their saved visuals.
Review the complete video, not just one attractive frame
Watch from the opening through the ending with sound. Check whether the picture changes for a reason, whether you can follow the captions, and whether the same phrase appears in too many places.
Some scenes can be simple. An illustration, a diagram and a short text emphasis can work together without giving every scene the same treatment. Make the choice around the content rather than a quota for images or animation.
Make a video from your own text, read the scene visuals help, or follow the article-to-video walkthrough.